IB Economics SL
Mock Exam Set 1 - Paper 2
Answer Question 1 or Question 2 below. Answer all parts of the question you choose.
1ai
Mark as Complete
Define the term inward foreign direct investment indicated in bold (Text A, paragraph 4). [2]
Mark Scheme
:
Inward foreign investment is spending on physical capital by foreign investors. It can also include foreign investors buying domestic firms.
:
For explaining that:
- it comes into a country from foreign sources—that is, it is an injection ()
- it refers to investment in capital, plant or equipment, or purchasing a firm ()
1aii
Mark as Complete
Define the term economic inequality indicated in bold (Text A, paragraph 5). [2]
Mark Scheme
:
Economic inequality occurs when households in an economy earn different levels of income and control different amounts of wealth.
:
For explaining that:
- economic inequality refers to the unequal distribution ()
- of both income and wealth in an economy ()
1bi
Mark as Complete
Using information from Table 1, calculate the inflation rate in Argentina from 2018- 2019. [3]
Mark Scheme
:
:
For correctly:
-
Selecting the data from the relevant years ()
- 2018 CPI: 142.00
- 2019 CPI: 211.58
-
Applying the percent change formula and showing the calculation ()
-
Calculating the inflation rate ()
- 49
1bii
Mark as Complete
Sketch a business cycle diagram to show how frequent policy changes have impacted Argentina's economy (Text A, paragraph 2, Table 1). [2]
Mark Scheme
:

:
For sketching a correctly labelled business cycle diagram
- that shows an upward-sloping (expansion) and downward-sloping (contraction) actual output curve ()
- for identifying that Argentina's economy expanded from 2016 to 2017 and contracted from 2018 to 2019 ()
1c
Mark as Complete
Using a demand and supply diagram, explain why price controls have not effectively lowered inflation in Argentina (Text B, paragraph 1). [4]
Mark Scheme
:

When the Argentine government sets a price ceilinga type of price controlto keep the price of rental housing low, it causes a disequilibrium in the market. This occurs because the maximum price () is set below the market price (P) causing quantity demanded to exceed quantity supplied. This results in a shortage () and incentivises landlords to charge higher rents () in informal markets. Therefore, inflation in Argentina does not decrease.
:
For drawing a correctly labelled demand and supply diagram showing:
- a price ceiling (price control) set below the market (equilibrium) price ()
- either of the following ()
- a shortage at the market price
- a price above market price/price control representing the price in informal markets
AND
Explaining that the price control prevents the rental housing market from reaching equilibrium:
- lowering price below equilibrium causes a shortage ()
- either of the following ()
- shortages drive up prices
- suppliers can charge higher prices in informal markets
1d
Mark as Complete
Using an exchange rate diagram, explain how monetary policy can be employed to achieve currency stability (Text B, paragraph 3). [4]
Mark Scheme
:

To slow the depreciation of the ARS, monetary policy can be used to increase interest rates. Foreign investors—seeking to earn greater interest—will buy more pesos to buy more Argentinian investments. This shifts demand for ARS rightward ( to ), putting upward pressure on the peso ( to ).
:
For drawing a correctly labelled exchange rate diagram showing:
- the demand curve for Argentinian pesos (ARS) shifting right or the supply curve for Argentinian pesos (ARS) shifting left ()
- the exchange rate increasing ()
AND
Explaining that contractionary monetary policy—raising interest rates—can increase the value of the ARS (), because demand (supply) for ARS in the foreign exchange market increases (decreases) as foreign (domestic) investors are incentivised to buy more interest-bearing investments in Argentina ().
1e
Mark as Complete
Using a production possibilities diagram, explain the impact Argentina's foreign debt has on its ability to provide infrastructure or social services (Text B, paragraph 2). [4]
Mark Scheme
:
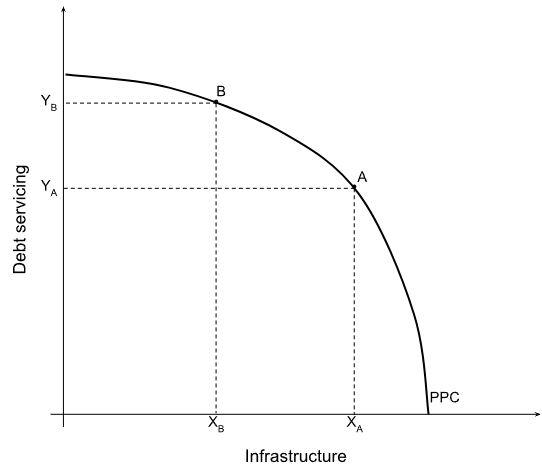
Argentina must repay its debt to foreign creditors such as the IMF. Consequently, debt servicing reduces the funds available for infrastructure. If Argentina's spending on debt servicing increases ( to ), then it must decrease infrastructure spending ( to ), so Argentina is less able to build or maintain infrastructure.
:
For drawing a correctly labelled PPC showing:
- a trade-off between debt servicing and infrastructure/social services ()
- increasing debt services decreases infrastructure/social services ()
OR
For drawing a correctly labelled PPC showing:
- using resources for debt servicing shifts the PPC inward ()
- the provision of infrastructure/social services decreases ()
AND
Explaining that:
- Resources used for debt servicing cannot be used to provide infrastructure or social services ()
- Therefore Argentina faces a trade-off: increasing payments to debt servicing reduces the funds available to provide infrastructure or social services ()
1f
Mark as Complete
Using an AD/AS diagram, explain how the development of the Vaca Muerta shale formation will impact economic output in Argentina (Text A, paragraph 3). [4]
Mark Scheme
:

Developing the Vaca Muerta shale formation will increase aggregate demand. This occurs due to increased spending on physical capital and labour, increasing investment and consumption, which are components of AD. As a result, AD shifts rightward ( to ), increasing economic output ( to ).
:
For drawing a correctly labelled AD/AS diagram showing:
- a rightward shift of AD or LRAS ()
- increased output ()
AND
Explaining that expanding the Vaca Muerta shale field will create economic growth () because:
- Investment and consumption will increase, increasing AD ()
OR - Economic potential will increase, increasing LRAS ()
1g
Mark as Complete
Using information from the text/data and your knowledge of economics, discuss the impacts of high inflation on economic growth and development in Argentina. [15]
Mark Scheme
:
Economic growth refers to an increase in gross domestic product GDP over time , whereas economic development refers to changes that enhance the quality of life, such as improved healthcare or increased access to clean drinking water .
CPI increased from 142.0 to 211.58 between 2018 and 2019, representing a 49% rate of inflation, which can be detrimental to the economy. It can erode Argentina’s export competitiveness as rising production costs put upward pressure on export prices . This is especially significant given that agriculture contributes around 60% of Argentina's total export revenues. Even though the nation was able to achieve a trade surplus of 14.41 billion in 2019 , however, given the abundance of global suppliers of agricultural products, rising inflation in Argentina may reduce demand for the agriculture output. This may have a significant effect on not only Argentina’s trade balance but also the employment in agriculture-related industries. Additionally, the rising inflation may undermine investor confidence in the economy, not only further discouraging FDI, but potentially leading to capital flight . This requires Argentina to diversify its national output, which can be achieved by focusing further on strengthening its energy sector, especially utilising abundant resources such as lithium, a key raw material used in electric vehicle batteries. This would not only open up domestic opportunities for firms but may have the potential to attract foreign firms who seek to benefit from low-cost materials, possibly generating employment opportunities in related industries .
Furthermore, the government can use a portion of the US44 billion IMF loan to fund the further exploration and extraction of lithium . This loan can also be partly used to subsidise technology to support agriculture production, which may improve productivity over time, putting downward pressure on prices, and subsequently the rate of inflation . However, these loans include conditions such as fiscal consolidation, aimed at reducing the fiscal deficit to 2.5% of GDP by 2022 , which may make it difficult for the government to provide such subsidies. This may adversely affect Argentina's social welfare programs and subsidies targeting lower-income segments of society who are already feeling the effects of an inflation rate of around 50%.
Furthermore, the US44 billion IMF loan will raise Argentina's external debt, which is already a concern given that a significant portion of the budget has to be set aside for debt servicing. This may continue to hamper Argentina's ability to fund its social welfare programmes which may compromise development . Additionally, Argentina’s commitment with the IMF’s condition to use tight monetary policy to reduce the rate of inflation may come at the expense of hampered growth and subsequent development. Theoretically, this may encourage foreigners to invest in Argentinian financial assets, strengthening the peso, but given the economic conditions, this is a less likely outcome.
The Vaca Muerta shale formation also offers the nation an opportunity for economic growth, but this requires consistency in economic policies , an area where the Argentinian government has been lacking. If the government is successful in strategizing the extraction of such resources, it will not only trigger export-led economic growth, but also help to diversify the composition of national output, thereby, reducing reliance on agriculture output .
The impacts of this can be seen in the diagram below. An increase in export oil and gas can increase net exports causing an increase in aggregate demand, shifting the AD curve shifts rightwards , causing real GDP to increase from to i.e. economic growth . However, this may put upwards pressure on price levels in the short run, but may present opportunities of improved living standards, raising tax revenues for the government, which can be used to fund public spending on development programmes which can help lower the rate of relative poverty below the current 35.5%.

Conclusively, Argentina faces significant challenges due to its high inflation rate. The decline in export competitiveness in key sectors like agriculture threatens the trade balance and employment opportunities. To address these issues, diversification of the national output, particularly by tapping into the energy sector's potential, such as the exploitation of resources like lithium, presents a viable solution. Utilising the IMF loan to fund initiatives in both energy and agriculture sectors may enhance productivity and mitigate inflationary pressures. However, fiscal consolidation and public debt concerns may limit the government's ability to allocate resources to essential social welfare programs. Strategic utilisation of resources like the Vaca Muerta shale formation could offer avenues for export-led growth and economic development, provided consistent policies are implemented .
:
For correctly using the term economic growth, indicating that it refers to an increase in real GDP over time. ()
For correctly using the term economic development, indicating that it refers to an improvement in the quality of life. ()
[2 maximum]
For including a correctly labelled AD/AS diagram:
- showing a rightward shift of the AD curve ()
- indicating an increase in real GDP ()
Linking the idea of economic growth to the diagram. ()
[3 maximum]
Identifying two of the following impacts on the Argentine economy (a-c): ()
Explaining two of the following impacts of high inflation on the Argentine economy: ()
-
High inflation can reduce export competitiveness by elevating the relative prices of exports, making them less appealing to foreign buyers.
-
High inflation can reduce business confidence because it erodes profits and increases costs, leading to reduced foreign direct investment or capital flight.
-
High inflation discourages savings because it lowers real interest rates, leading to lower levels of investment.
[3 maximum]
For adding context to the explanation by discussing ()
-
If Argentina diversifies its national output, this would open up opportunities for firms and generate employment.
or
-
How an increase in GDP can contribute to economic development over time.
For making a reasoned argument for one point of view ()
- e.g., arguing that consistency in economic policies can allow Argentina to achieve economic growth as it may reduce capital flight.
For making a reasoned argument for another point of view ()
- e.g., arguing that the IMF loan will raise Argentina's external debt, which may hamper its ability to fund its social welfare programmes.
For providing an evaluative judgement that resolves the specific demands of the question ()
- e.g., arguing that consistent policies and strategic utilisation of resources like the Vaca Muerta shale formation could result in export-led growth and economic development.
[4 maximum]
For using appropriate information from the text/data to support an argument ()
- e.g., Argentina can use the IMF loan to fund the further exploration of raw materials or improve infrastructure
For using appropriate information from the text/data to support another argument ()
- e.g.,the IMF conditions can put pressure on the government, which may conflict with their macroeconomic objectives.
For incorporating the information from the extract into the synthesis/evaluation. ()
- e.g., successful development of resources like the Vaca Muerta shale formation depend on policies that improve stability
[3 maximum]
[=15 maximum]
2ai
Mark as Complete
Define the term bilateral agreement indicated in bold (Text D, paragraph 3). [2]
Mark Scheme
:
A bilateral agreement is a trade agreement between two countries to reduce or eliminate tariffs and other barriers to trade.
:
For explaining that a bilateral agreement
- is a trade agreement between two countries ()
- aims to reduce or eliminate tariffs or other barriers to trade ()
2aii
Mark as Complete
Define the term sustainable development indicated in bold (Text E, paragraph 2). [2]
Mark Scheme
:
Sustainable development is economic development that meets the needs of
the present generations without compromising the ability of future generations to meet their own needs.
:
For explaining that sustainable development meets the needs of both current () and future () generations.
2bi
Mark as Complete
Using information from Table 5, calculate the balance of trade. [2]
Mark Scheme
:
Balance of trade = balance of trade in goods - balance of trade in services
Balance of trade = [313 mil - 2.2 bil] + [3.1bil - 1.2bil]
Balance of trade = -1.887 billion +1.9 billion
= US$ 0.013billion
OR
Balance of trade =[313 000 000-2 200 000 000] +[3 100 000 000-1 200 000 000]
= 1 900 000 000-1 887 000 000
=US$13 000 000
:
For correctly:
- calculating the correct balance of trade by adding the balances on visible (goods) and invisible (services) trade ()
- writing correct final answer with the correct unit ()
US$0.013 billion OR US$13 000 000
2bii
Mark as Complete
Using the information in Table 5 and your answer to (b)(i), calculate the current account balance. [3]
Mark Scheme
:
Current account balance =
0.013 billion + (72 million - 444 million) +(-1.1 billion)
= US$ -1.459 billion (deficit)
OR
= 13 000 000 + (72 000 000-444 000 000) + (-1 100 000 000)
= US$ -1 459 000 000
:
Current account = trade balance + net income payments + net transfers

For correctly:
- selecting the relevant data ()
- calculating the current account balance by adding balances on net transfers and net income to the answer from (b)(i)()
For the correct answer with the correct units ()
-US$1.46 billion
2c
Mark as Complete
Using a demand and supply diagram, explain how government subsidies on fuel may help the Maldives economy achieve economic growth (Text D, paragraph 2). [4]
Mark Scheme
:

As shown in the diagram, subsidies provided for fuel will help producers to increase their supply ( to ) and reduce consumer prices ( to ). Fuel is an essential input for the fishing and aquaculture industries, so subsidies on fuel reduce their operating costs. By providing economic support to producers, the government aims to increase production in these industries, thereby increasing economic output.
:
For drawing a correctly labelled demand and supply diagram showing:
- a downward/rightward shift of the supply curve ()
- either of the following ()
- an increase in quantity
- a fall in price
AND
Explaining that subsidies on fuels create economic growth by:
- decreasing operating costs ()
- incentivising producers to increase supply ()
2d
Mark as Complete
Using a production possibilities diagram, explain the impact of Maldives’ government spending on infrastructure (Text D, paragraph 5). [4]
Mark Scheme

Maldives is building infrastructure like an international airport and Agronat Corporation to support agriculture. Thus, limited resources of the economy are diverted towards increasing economic infrastructure from to . However, as the economy reallocates its limited resources, it would need to cut down its social spending from to .
:
For drawing a correctly labelled PPC showing:
- a trade-off between economic infrastructure and social spending ()
- increasing expenditure on economic infrastructure decreases social spending ()
AND
Explaining that providing more economic infrastructure reduces funds available for social services (). Therefore, Maldives faces a trade-off: increasing economic infrastructure reduces the provision of social services ().
2e
Mark as Complete
Using an international trade diagram, explain the effect of India imposing tariffs on imports from Maldives (Text D, paragraphs 3 and 4). [4]
Mark Scheme
:

If India imposes a tariff on goods imported from Maldives (tuna fish and scrap iron), then the volume of imports will reduce. In a free market, the world supply curve is perfectly elastic att he world price, . At price without any barrier, the Indian producers supply only as is lower than the domestic equilibrium price, and the quantity demanded is . The shortage ( - ) is imported, including from Maldives. But if India decides to impose a barrier in the form of a tariff, then the new price () will shift upward by a fixed amount. At this new price, Indian producers are willing to supply an increased quantity () but the quantity demanded contracts to units. The shortage (- ) can be imported. However, the tariff causes a reduction in the volume of imports. This reduces the revenue of foreign exporters but will increase the Indian government revenue for the collection of tariff revenue equal to area e.
:
For drawing a correctly labelled international trade diagram showing:
- the domestic quantity supplied and demanded with shortage imported without any trade barrier ()
- the domestic quantity supplied and demanded with reduced imports after a tariff barrier is imposed ()
AND
Explaining that: in a free market and at world price which is below the domestic equilibrium price a country can import larger volume of goods () after a tariff barrier is imposed the world price also increases causing a reduction in the volume of imports ()
2f
Mark as Complete
Using a market failure diagram, explain the effect of climate change on the fishing industry in Maldives (Text F, paragraphs 1 and 2). [4]
Mark Scheme
:

Many industrial and production processes release greenhouse gases leading to climate change. Thus, as illustrated in the diagram, marginal social costs (MSC) exceed marginal private costs (MPC) due to the harmful effects of climate change. The socially optimal output is at where MSC=MSB. From society’s point of view there is overproduction and a corresponding welfare loss is shown by the triangle. Maldives is particularly vulnerable to the effects of climate change, due to an increased risk of flooding, and dwindling stocks of fish thus causing a market failure. Additionally climate change necessitates fishermen to travel further to find fish, resulting in an increased fuel cost and additional expenses for the fishing industry. Maldives heavily depends on fish product exports thus making the country vulnerable to market failures.
:
For drawing a correctly labelled market failure diagram showing:
- that the marginal social cost is greater than the marginal private cost due to negative externalities of an increase in economic activities ()
- that there is overproduction of goods in a free market, creating a welfare/deadweight loss ()
AND
Explaining that:
- an increase in economic activities affects the climate, and in turn impacts availability of natural resources ()
- the above mentioned changes further adds to an increased cost of production to firms and society at large ()
2g
Mark as Complete
Using information from the text/data and your knowledge of economics, discuss the need for more government intervention in Maldives to promote economic development. [15]
Mark Scheme
:
Economic development refers to the process by which the overall health, well-being, and academic level of the general population of a nation improves . The three core and interrelated pillars of sustainable developmentsocial sustainability, economic sustainability and environmental sustainabilityare vital to development . Maldives experienced high economic growth prior to the pandemic, but the loss of tourism income due to the Indian boycott placed a significant challenge on the economy .
To mitigate the economic challenges arising from the decline in tourism , the Maldives government has taken steps to increase fishing and aquaculture as industries, including subsidies for fuel . This would help in overcoming the loss of revenue, promoting a more equitable distribution of income. However, the impact of government intervention has time lags, and any spending and intervention has an opportunity cost as the government cannot allocate this expenditure to other sectors . Government spending, although fluctuating over the past five years, has continued to rise, but so has the debt-to-GDP ratio, sitting at around in 2022. This debt comes with a cost as there is a liability of interest and principal amount, creating a budgetary strain.
Additionally, to increase financial opportunities for poorer residents living on the outer atolls, Maldives’ government is seeking FDI from Singapore. To improve sustainability, the Maldives government is also looking into renewable energy and waste management .This would help in ensuring that resources are available for future generations . By considering the long run impact of its policies, Maldives government aims to achieve sustainable economic growth .

In the diagram, one can see that currently, Maldives is operating at any point on . However, over a long period of time, foreign aid and the building of economic infrastructure will help the Maldives government to achieve growth indicated by a rightward shift ( to ) .
However, Maldives’ geography limits the gains of infrastructure improvements. Improving infrastructure on one island may not have much impact on residents of other islands . The government is also looking at the social aspect of development by ensuring that residents in outer islands receive potable water in case of a shortage of freshwater . This ensures the well-being of people as their basic needs are met.
In conclusion, achieving sustainable development in Maldives requires a multifaceted strategy encompassing economic diversification, environmental conservation, foreign partnerships, and social welfare, especially in the face of rising challenges .
:
For correctly defining the term economic development by indicating that:
- development refers to the process by which the overall health, well-being, and academic level of the general population of a nation improve ()
For correct use of other relevant terms ()
- e.g., social sustainability, economic sustainability and environmental sustainability, opportunity cost
[2 maximum]
A PPC diagram showing:
- An outward shift of the PPC showing economic growth ()
OR
An AD/AS diagram showing:
- A rightward shift of the LRAS curve leading to an increase in real GDP ()
AND
Linking the idea of economic growth to potential outcomes of the economy ()
[2 maximum]
For identifying distinct ways government intervention can contribute to economic development ()
- e.g., governments are well-suited to provide infrastructure, target specific segments of the population/economy, or improve institutions or the business environment
For explaining any two of the following: ()
- Government intervention helps to overcome economic challenges and provide stability
- Governments can encourage sustainable practices to ensure resources are available for future generations
- Ensuring social aspects of development for well being
[3 maximum]
For adding context to the response by discussing the unique challenges faced by Maldives ()
- e.g., Maldives’ geography limits the impacts of some government intervention
For making arguments supporting government intervention ()
- e.g., Maldives government can enact policies promoting sustainable economic development
For making arguments about the limitations of government intervention ()
- e.g., arguing that time lags limit the effectiveness of government intervention
Providing an evaluative judgement that resolves the specific demands of the essay question. ()
- e.g., Economic development in Maldives requires a multi-faceted approach in light of increasing climate challenges
[4 maximum]
For using text/data to:
- demonstrate the need for government intervention to promote development in Maldives ()
- support an argument for a method of government intervention ()
- support an argument for another method of government intervention ()
- For incorporating text/data into synthesis/evaluation ()
[4 maximum]
[=15 maximum]
Extracts:
Question 1
Read the extracts and answer the related questions.
Text A: Overview of Argentina
. Argentina's economy, endowed with extensive natural resources, a population with literacy rates above , and a robust agricultural sector, presents a multifaceted and dynamic economic scenario. Despite its inherent strengths, the nation faces a series of economic challenges, deeply rooted in the interplay of domestic political shifts and global economic trends.
. As a leading exporter, Argentina's agricultural sector, particularly its beef, soybeans, and wheat production, is a cornerstone of the national economy. Agriculture contributes about of the country's total export revenues. However, Argentina's heavy dependence on agriculture makes its economy highly sensitive to global commodity price swings. This vulnerability is exacerbated by persistent issues such as high inflation, which reached around in recent years, and a volatile currency. These economic conditions, coupled with frequent policy changes by successive governments, have led to repeated cycles of economic recession and recovery.
. In recent years, Argentina has shifted focus towards bolstering its energy sector, with an emphasis on renewable energy sources and the exploitation of its abundant natural resources such as lithiumcrucial for the burgeoning electric vehicle marketand shale oil and gas reserves. The Vaca Muerta shale formation, one of the world's largest reserves of shale oil and gas, represents a significant opportunity for economic growth. However, fully capitalizing on this opportunity requires stable economic policies and continuous investment inflows.
. Inward foreign direct investment in Argentina has fluctuated, impacted by the nation's oscillating economic policies and the broader global economic environment. Despite its potential, Argentina's economy has often struggled to attract consistent foreign investment. In an effort to stabilize the economy, Argentina has sought financial assistance from international entities like the International Monetary Fund (IMF). However, these relationships have been complex, marked by challenges and negotiations over debt restructuring and financial support.
. The Argentine government's focus on social welfare programs and subsidies aimed at supporting the lower-income population, reflects its commitment to addressing social issues. These initiatives, critical for poverty alleviation and reducing economic inequality, have, however, placed a significant strain on the country's fiscal health. Argentina's public debt, a considerable portion of which is foreign debt, has remained high, posing challenges to the nation's financial stability and economic growth prospects.
Text B: Challenges for Argentina
. Argentina's economy is significantly hampered by high inflation, leading to reduced consumer purchasing power and creating an unpredictable business climate. Various strategies, such as monetary policy adjustments and price controls on rental housing, have been employed to combat inflation. However, despite these measures, inflation continues to be a critical challenge, affecting both domestic economic stability and Argentina's position in the global market.
. The country's substantial foreign debt is a major economic concern. Debt servicing takes up a significant portion of Argentina's financial resources, limiting its capacity for investment in key areas like infrastructure and social services. This situation also impacts Argentina's ability to access international financial markets, making debt management a delicate balancing act between meeting creditors' demands and ensuring national economic health.
. The Argentine peso's (ARS) fluctuation against major currencies, particularly the US dollar, poses ongoing challenges. This volatility affects international trade, business investment decisions, and the cost of imports. The government has implemented various policies, including foreign exchange controls and monetary policy interventions, to achieve currency stability. Nonetheless, attaining a stable and predictable currency remains crucial for Argentina's economic growth and stability.
. Stimulating sustainable economic growth while reducing unemployment is a key focus for Argentina. The government aims to create a welcoming environment for businesses, encourage entrepreneurship, and address structural issues in the labour market, such as skill gaps and informal employment. These efforts are directed towards generating jobs, especially for the youth and in underprivileged areas, to foster inclusive and long-term economic progress.
Text C: International Monetary Fund (IMF) financial assistance to Argentina
In 2022, the IMF approved US44 billion in loans to Argentina. These loans include conditions such as fiscal consolidation, aimed at reducing the fiscal deficit; monetary policy adjustments to control inflation; and structural reforms for economic efficiency. These measures also focus on debt sustainability and enhancing transparency in governance. For example, in a recent agreement, Argentina committed to a fiscal deficit target of of GDP by 2022, down from in 2021, as part of its fiscal consolidation efforts. These conditions are designed to stabilize the economy and ensure long-term fiscal responsibility.
Table 1: Economic data for Argentina
| 2016 | 2017 | 2018 | 2019 | |
|---|---|---|---|---|
| Consumer Price Index | 79.37 | 100.00 | 142.00 | 211.58 |
| Real GDP (US billion) | 557.53 | 643.63 | 524.82 | 447.75 |
| Exports (US billion) | 69.84 | 72.86 | 75.77 | 80.26 |
| Imports (US billion) | 75.64 | 89.91 | 85.68 | 65.85 |
Table 2: Development data for Argentina
| 2019 | |
|---|---|
| Human Development Index (HDI) | 0.852 |
| Inequality-adjusted HDI | 0.729 |
| Adult literacy rate () | 99.5 |
| Relative poverty rate () | 35.5 |
Question 2
Read the extracts and answer the related questions.
Text D: Overview of the Maldives
. Maldives is a country of more than five hundred thousand people with a GDP per capita of approximately US$11 000 in 2022. While they experienced high economic growth prior to the pandemic, the loss of tourism income presented a significant challenge to the economy. During this time period, Maldives also experienced a net loss of migration as many foreign workers returned to their home countries. That impact, plus a declining fertility rate, meant the overall population grew only slightly from 2019 to 2023.
. Tourism plays a large part of the Maldives economy, with the largest number of tourists coming from India, followed by Russia and China. Tourism accounts for one-third of GDP and combined with services makes up three-fourths of Maldives' national income. Recognising such a perilous situation, the government has taken steps to increase fishing and aquaculture as industries, including subsidies for fuel.
. Maldives' main trading partners are India, China, United Arab Emirates, and Thailand, with the last being a net export country. The top imports include gas, household goods, and milk. Maldives’ top exports are fish, especially tuna, and scrap iron. Maldives is a member of the South Asian Free Trade Agreement (SAFTA) and is a member of the WTO. Maldives signed a bilateral agreement with China in 2017, but do not have any such agreements with other Commonwealth members.
. A growing dispute over the placement of Indian troops in Maldives is leading to the potential of a decline in tourism and trade with India. A 2023 tourism boycott of the Maldives had an immediate impact on revenue, and there is a possibility that India will enact trade barriers despite their joint membership in SAFTA. Maldives has said it will look to China for increased ties.
. Government spending, although fluctuating over the past five years, has continued to rise, but so has the debt-to-GDP ratio, sitting at around in 2022. Much of the government investment has been in infrastructure projects including the new international airport as well as the newly established AgroNat Corporation which focuses on agriculture. However, the cost-conscious government has reduced social spending, including on education.
Text E: FDI in Maldives
. Foreign Direct Investment (FDI) in Maldives has historically focused on hotel franchising and air transportation. The other major industries are insurance, banking, and telecommunications. FDI related to construction has been limited by laws requiring a certain percentage of Maldivian ownership. Foreign investors are rarely permitted to own land so partnering with nationals is essential.
. Maldives has looked to Singapore for increased FDI, specifically in the areas of tourism, renewable energy, waste management, and job training. The hope is that this will contribute to an increase in sustainable development and also include increased financial opportunities for poorer residents living on the outer atolls(islands) that do not currently benefit from the tourism industry.
. Since the pandemic, Maldives has actively sought foreign aid and Official Development Assistance from a number of places including the IMF, the World Bank, and the Asian Development Fund. The economic impact of the loss of revenue from the tourism industry was particularly harmful to self-employed workers, and Maldives is seeking support for those residents.
Text F: Climate change’s impact on the fishing industry.
. As a low-lying island chain, Maldives is particularly vulnerable to the effects of climate change, not only due to the increased risk of flooding but the impacts on coral reefs and the fishing industry. Maldives has been very vocal about what the potential for changes in the cost of production will do to the supply chain for tuna as fishermen have to travel further out to sea to catch fish.
. While Maldives has the right to fish its own waters, the dwindling stocks of fish due to climate change could lead to depletion of the available fish. With the export market so dependent on fish products, this could also lead to other impacts on Maldives’ trade relationships.
. Another impact of climate change is on the availability of potable water. Maldives now relies on shipments of water from abroad, which can sometimes take up to two weeks to arrive. When there are shortages of fresh water, residents have to rely on bottled plastic water which increases in cost. Residents in outer islands generally don’t have access to this unless the government transports it to them, which is another drain on the national budget.
Table 3: Maldives GDP
| Year | Nominal GDP (US$ bil) |
|---|---|
| 2018 | 5.4 |
| 2019 | 5.73 |
| 2020 | 3.71 |
| 2021 | 5.25 |
| 2022 | 6.17 |
Table 4: Unemployment Rate in Maldives
| Year | 2019 | 2020 | 2021 | 2022 |
|---|---|---|---|---|
| Uneployment Rate % | 5.3 | 6.3 | 6.1 | 4.9 |
Table 5: Key Trade Statistics (US$)
| (billions) | |
|---|---|
| Imports (Goods) | 2.2 |
| Imports (Services) | 1.2 |
| Exports (Goods) | 0.313 |
| Exports (Services) | 3.1 |
| Remittances | 0.556 |
| FDI | -0.721 |
| Net Transfers | -1.1 |
| Income Receipts | 0.072 |
| Income Payments | 0.444 |
| Foreign Reserves | 0.978 |
References
Text A
The Growth Lab at Harvard University. The Atlas of Economic Complexity. http://www.atlas.cid.harvard.edu. Source adapted.
OECD (2024), Inflation (CPI) (indicator). https://data.oecd.org/price/inflation-cpi.htm. doi: 10.1787/eee82e6e-en (Accessed on 06 February 2024). Source adapted.
Text B
World Bank Open Data. (2024). Official exchange rate (LCU per US, period average) - Argentina: International Monetary Fund, International Financial Statistics. Retrieved Feb. 6, 2024, from https://data.worldbank.org. Source adapted. CC BY 4.0.
Text C
International Monetary Fund. (2023, Aug. 8). “IMF Executive Board Completes the Combined Fifth and Sixth Reviews of the Extended Arrangement Under the Extended Fund Facility for Argentina”. https://www.imf.org/en/Home. Retrieved, Feb. 6, 2024, from https://www.imf.org/en/News/Articles/2023/08/23/pr23290-argentina-imf-executive-board-completes-combined-fifth-sixth-rev-extended-arr-under-eff. Source adapted.
Table 1
World Bank Open Data. (2024). https://data.worldbank.org. Retrieved Jan. 24, 2024, from https://data.worldbank.org. Source adapted. CC BY 4.0.
Table 2
World Bank Open Data. (2024). https://data.worldbank.org. Retrieved Jan. 24, 2024, from https://data.worldbank.org. Source adapted. CC BY 4.0.
Human Development Report. (2024). United Nations Development Programme. Retrieved Jan. 24, 2024, from https://hdr.undp.org/data-center/country-insights#/ranks. Source adapted. CC BY 4.0.
Text D
World Bank Open Data. (2024). Net migration: United Nations Population Division. World Population Prospects: 2022 Revision. Retrieved Feb.1, 2024, from https://data.worldbank.org. Source adapted. CC BY 4.0.
Statista. (2024). The Most Important Markets for the Maldives Tourism Industry. Retrieved on January 19, 2024, from https://www.statista.com/chart/31536/countries-with-the-most-tourists-traveling-to-the-maldives. Source adapted.
Abdulla, Lamya. (2022, October 27). State has spent MVR 4 billion in the past three years over subsidies. The Edition. Retrieved on January 19, 2024, from https://edition.mv/subsidy/26124. Source adapted.
The Observatory of Economic Complexity. (n.d.). Maldives (MDV) Exports, Imports, and Trade Partners. Retrieved on January 19, 2024, from https://oec.world/en/profile/country/mdv. Source adapted.
Raajje.mv. (2021, January 24). Agricultural programs commence in three northernmost atolls. Retrieved on January 19, 2024, from https://raajje.mv/94251. Source adapted.
The World Bank. 2024. Government expenditure on education, total (% of government expenditure) - Maldives. Retrieved on January 19, 2024, from https://data.worldbank.org/indicator/SE.XPD.TOTL.GB.ZS?locations=MV. Source adapted. CC BY 4.0.
Text E
United States Department of State. (2022). Maldives - 2022 Investment Climate Statements. Retrieved on January 19, 2024, from https://www.state.gov/reports/2022-investment-climate-statements/maldives/. Source adapted.
Indiplomacy. (2023, August 1). Singapore and Maldives Multiplying Strength on Many Fronts. Retrieved on January 19, 2024, from https://indiplomacy.com/2023/08/01/singapore-and-maldives-multiplying-strength-on-many-fronts. Source adapted.
Raajje.mv. (2021, April 15). Maldives seeks over USD 200 million in foreign aid to combat Covid-19. Retrieved on January 19, 2024, from https://raajje.mv/76095. Source adapted.
Text F
United Nations Development Programme. (n.d.). Waters of Paradise - Adapting to Climate Change in the Maldives. Retrieved on January 19, 2024, from https://www.adaptation-undp.org/resources/videos/waters-paradise-adapting-climate-change-maldives. Source adapted. CC BY 4.0.
Table 3
World Bank Open Data. (2024). GDP (current US$): World Bank national accounts data, and OECD National Accounts data files. Retrieved Feb.1, 2024, from https://data.worldbank.org. Source adapted. CC BY 4.0.
Table 5
The Observatory of Economic Complexity. (n.d.). Maldives (MDV) Exports, Imports, and Trade Partners. Retrieved on January 19, 2024, from https://oec.world/en/profile/country/mdv
1ai
Mark as Complete
Define the term inward foreign direct investment indicated in bold (Text A, paragraph 4). [2]
Mark Scheme
:
Inward foreign investment is spending on physical capital by foreign investors. It can also include foreign investors buying domestic firms.
:
For explaining that:
- it comes into a country from foreign sources—that is, it is an injection ()
- it refers to investment in capital, plant or equipment, or purchasing a firm ()
1aii
Mark as Complete
Define the term economic inequality indicated in bold (Text A, paragraph 5). [2]
Mark Scheme
:
Economic inequality occurs when households in an economy earn different levels of income and control different amounts of wealth.
:
For explaining that:
- economic inequality refers to the unequal distribution ()
- of both income and wealth in an economy ()
1bi
Mark as Complete
Using information from Table 1, calculate the inflation rate in Argentina from 2018- 2019. [3]
Mark Scheme
:
:
For correctly:
-
Selecting the data from the relevant years ()
- 2018 CPI: 142.00
- 2019 CPI: 211.58
-
Applying the percent change formula and showing the calculation ()
-
Calculating the inflation rate ()
- 49
1bii
Mark as Complete
Sketch a business cycle diagram to show how frequent policy changes have impacted Argentina's economy (Text A, paragraph 2, Table 1). [2]
Mark Scheme
:
:
For sketching a correctly labelled business cycle diagram
- that shows an upward-sloping (expansion) and downward-sloping (contraction) actual output curve ()
- for identifying that Argentina's economy expanded from 2016 to 2017 and contracted from 2018 to 2019 ()
1c
Mark as Complete
Using a demand and supply diagram, explain why price controls have not effectively lowered inflation in Argentina (Text B, paragraph 1). [4]
Mark Scheme
:
When the Argentine government sets a price ceilinga type of price controlto keep the price of rental housing low, it causes a disequilibrium in the market. This occurs because the maximum price () is set below the market price (P) causing quantity demanded to exceed quantity supplied. This results in a shortage () and incentivises landlords to charge higher rents () in informal markets. Therefore, inflation in Argentina does not decrease.
:
For drawing a correctly labelled demand and supply diagram showing:
- a price ceiling (price control) set below the market (equilibrium) price ()
- either of the following ()
- a shortage at the market price
- a price above market price/price control representing the price in informal markets
AND
Explaining that the price control prevents the rental housing market from reaching equilibrium:
- lowering price below equilibrium causes a shortage ()
- either of the following ()
- shortages drive up prices
- suppliers can charge higher prices in informal markets
1d
Mark as Complete
Using an exchange rate diagram, explain how monetary policy can be employed to achieve currency stability (Text B, paragraph 3). [4]
Mark Scheme
:
To slow the depreciation of the ARS, monetary policy can be used to increase interest rates. Foreign investors—seeking to earn greater interest—will buy more pesos to buy more Argentinian investments. This shifts demand for ARS rightward ( to ), putting upward pressure on the peso ( to ).
:
For drawing a correctly labelled exchange rate diagram showing:
- the demand curve for Argentinian pesos (ARS) shifting right or the supply curve for Argentinian pesos (ARS) shifting left ()
- the exchange rate increasing ()
AND
Explaining that contractionary monetary policy—raising interest rates—can increase the value of the ARS (), because demand (supply) for ARS in the foreign exchange market increases (decreases) as foreign (domestic) investors are incentivised to buy more interest-bearing investments in Argentina ().
1e
Mark as Complete
Using a production possibilities diagram, explain the impact Argentina's foreign debt has on its ability to provide infrastructure or social services (Text B, paragraph 2). [4]
Mark Scheme
:
Argentina must repay its debt to foreign creditors such as the IMF. Consequently, debt servicing reduces the funds available for infrastructure. If Argentina's spending on debt servicing increases ( to ), then it must decrease infrastructure spending ( to ), so Argentina is less able to build or maintain infrastructure.
:
For drawing a correctly labelled PPC showing:
- a trade-off between debt servicing and infrastructure/social services ()
- increasing debt services decreases infrastructure/social services ()
OR
For drawing a correctly labelled PPC showing:
- using resources for debt servicing shifts the PPC inward ()
- the provision of infrastructure/social services decreases ()
AND
Explaining that:
- Resources used for debt servicing cannot be used to provide infrastructure or social services ()
- Therefore Argentina faces a trade-off: increasing payments to debt servicing reduces the funds available to provide infrastructure or social services ()
1f
Mark as Complete
Using an AD/AS diagram, explain how the development of the Vaca Muerta shale formation will impact economic output in Argentina (Text A, paragraph 3). [4]
Mark Scheme
:
Developing the Vaca Muerta shale formation will increase aggregate demand. This occurs due to increased spending on physical capital and labour, increasing investment and consumption, which are components of AD. As a result, AD shifts rightward ( to ), increasing economic output ( to ).
:
For drawing a correctly labelled AD/AS diagram showing:
- a rightward shift of AD or LRAS ()
- increased output ()
AND
Explaining that expanding the Vaca Muerta shale field will create economic growth () because:
- Investment and consumption will increase, increasing AD ()
OR - Economic potential will increase, increasing LRAS ()
1g
Mark as Complete
Using information from the text/data and your knowledge of economics, discuss the impacts of high inflation on economic growth and development in Argentina. [15]
Mark Scheme
:
Economic growth refers to an increase in gross domestic product GDP over time , whereas economic development refers to changes that enhance the quality of life, such as improved healthcare or increased access to clean drinking water .
CPI increased from 142.0 to 211.58 between 2018 and 2019, representing a 49% rate of inflation, which can be detrimental to the economy. It can erode Argentina’s export competitiveness as rising production costs put upward pressure on export prices . This is especially significant given that agriculture contributes around 60% of Argentina's total export revenues. Even though the nation was able to achieve a trade surplus of 14.41 billion in 2019 , however, given the abundance of global suppliers of agricultural products, rising inflation in Argentina may reduce demand for the agriculture output. This may have a significant effect on not only Argentina’s trade balance but also the employment in agriculture-related industries. Additionally, the rising inflation may undermine investor confidence in the economy, not only further discouraging FDI, but potentially leading to capital flight . This requires Argentina to diversify its national output, which can be achieved by focusing further on strengthening its energy sector, especially utilising abundant resources such as lithium, a key raw material used in electric vehicle batteries. This would not only open up domestic opportunities for firms but may have the potential to attract foreign firms who seek to benefit from low-cost materials, possibly generating employment opportunities in related industries .
Furthermore, the government can use a portion of the US44 billion IMF loan to fund the further exploration and extraction of lithium . This loan can also be partly used to subsidise technology to support agriculture production, which may improve productivity over time, putting downward pressure on prices, and subsequently the rate of inflation . However, these loans include conditions such as fiscal consolidation, aimed at reducing the fiscal deficit to 2.5% of GDP by 2022 , which may make it difficult for the government to provide such subsidies. This may adversely affect Argentina's social welfare programs and subsidies targeting lower-income segments of society who are already feeling the effects of an inflation rate of around 50%.
Furthermore, the US44 billion IMF loan will raise Argentina's external debt, which is already a concern given that a significant portion of the budget has to be set aside for debt servicing. This may continue to hamper Argentina's ability to fund its social welfare programmes which may compromise development . Additionally, Argentina’s commitment with the IMF’s condition to use tight monetary policy to reduce the rate of inflation may come at the expense of hampered growth and subsequent development. Theoretically, this may encourage foreigners to invest in Argentinian financial assets, strengthening the peso, but given the economic conditions, this is a less likely outcome.
The Vaca Muerta shale formation also offers the nation an opportunity for economic growth, but this requires consistency in economic policies , an area where the Argentinian government has been lacking. If the government is successful in strategizing the extraction of such resources, it will not only trigger export-led economic growth, but also help to diversify the composition of national output, thereby, reducing reliance on agriculture output .
The impacts of this can be seen in the diagram below. An increase in export oil and gas can increase net exports causing an increase in aggregate demand, shifting the AD curve shifts rightwards , causing real GDP to increase from to i.e. economic growth . However, this may put upwards pressure on price levels in the short run, but may present opportunities of improved living standards, raising tax revenues for the government, which can be used to fund public spending on development programmes which can help lower the rate of relative poverty below the current 35.5%.
Conclusively, Argentina faces significant challenges due to its high inflation rate. The decline in export competitiveness in key sectors like agriculture threatens the trade balance and employment opportunities. To address these issues, diversification of the national output, particularly by tapping into the energy sector's potential, such as the exploitation of resources like lithium, presents a viable solution. Utilising the IMF loan to fund initiatives in both energy and agriculture sectors may enhance productivity and mitigate inflationary pressures. However, fiscal consolidation and public debt concerns may limit the government's ability to allocate resources to essential social welfare programs. Strategic utilisation of resources like the Vaca Muerta shale formation could offer avenues for export-led growth and economic development, provided consistent policies are implemented .
:
For correctly using the term economic growth, indicating that it refers to an increase in real GDP over time. ()
For correctly using the term economic development, indicating that it refers to an improvement in the quality of life. ()
[2 maximum]
For including a correctly labelled AD/AS diagram:
- showing a rightward shift of the AD curve ()
- indicating an increase in real GDP ()
Linking the idea of economic growth to the diagram. ()
[3 maximum]
Identifying two of the following impacts on the Argentine economy (a-c): ()
Explaining two of the following impacts of high inflation on the Argentine economy: ()
-
High inflation can reduce export competitiveness by elevating the relative prices of exports, making them less appealing to foreign buyers.
-
High inflation can reduce business confidence because it erodes profits and increases costs, leading to reduced foreign direct investment or capital flight.
-
High inflation discourages savings because it lowers real interest rates, leading to lower levels of investment.
[3 maximum]
For adding context to the explanation by discussing ()
-
If Argentina diversifies its national output, this would open up opportunities for firms and generate employment.
or
-
How an increase in GDP can contribute to economic development over time.
For making a reasoned argument for one point of view ()
- e.g., arguing that consistency in economic policies can allow Argentina to achieve economic growth as it may reduce capital flight.
For making a reasoned argument for another point of view ()
- e.g., arguing that the IMF loan will raise Argentina's external debt, which may hamper its ability to fund its social welfare programmes.
For providing an evaluative judgement that resolves the specific demands of the question ()
- e.g., arguing that consistent policies and strategic utilisation of resources like the Vaca Muerta shale formation could result in export-led growth and economic development.
[4 maximum]
For using appropriate information from the text/data to support an argument ()
- e.g., Argentina can use the IMF loan to fund the further exploration of raw materials or improve infrastructure
For using appropriate information from the text/data to support another argument ()
- e.g.,the IMF conditions can put pressure on the government, which may conflict with their macroeconomic objectives.
For incorporating the information from the extract into the synthesis/evaluation. ()
- e.g., successful development of resources like the Vaca Muerta shale formation depend on policies that improve stability
[3 maximum]
[=15 maximum]
2ai
Mark as Complete
Define the term bilateral agreement indicated in bold (Text D, paragraph 3). [2]
Mark Scheme
:
A bilateral agreement is a trade agreement between two countries to reduce or eliminate tariffs and other barriers to trade.
:
For explaining that a bilateral agreement
- is a trade agreement between two countries ()
- aims to reduce or eliminate tariffs or other barriers to trade ()
2aii
Mark as Complete
Define the term sustainable development indicated in bold (Text E, paragraph 2). [2]
Mark Scheme
:
Sustainable development is economic development that meets the needs of
the present generations without compromising the ability of future generations to meet their own needs.
:
For explaining that sustainable development meets the needs of both current () and future () generations.
2bi
Mark as Complete
Using information from Table 5, calculate the balance of trade. [2]
Mark Scheme
:
Balance of trade = balance of trade in goods - balance of trade in services
Balance of trade = [313 mil - 2.2 bil] + [3.1bil - 1.2bil]
Balance of trade = -1.887 billion +1.9 billion
= US$ 0.013billion
OR
Balance of trade =[313 000 000-2 200 000 000] +[3 100 000 000-1 200 000 000]
= 1 900 000 000-1 887 000 000
=US$13 000 000
:
For correctly:
- calculating the correct balance of trade by adding the balances on visible (goods) and invisible (services) trade ()
- writing correct final answer with the correct unit ()
US$0.013 billion OR US$13 000 000
2bii
Mark as Complete
Using the information in Table 5 and your answer to (b)(i), calculate the current account balance. [3]
Mark Scheme
:
Current account balance =
0.013 billion + (72 million - 444 million) +(-1.1 billion)
= US$ -1.459 billion (deficit)
OR
= 13 000 000 + (72 000 000-444 000 000) + (-1 100 000 000)
= US$ -1 459 000 000
:
Current account = trade balance + net income payments + net transfers
For correctly:
- selecting the relevant data ()
- calculating the current account balance by adding balances on net transfers and net income to the answer from (b)(i)()
For the correct answer with the correct units ()
-US$1.46 billion
2c
Mark as Complete
Using a demand and supply diagram, explain how government subsidies on fuel may help the Maldives economy achieve economic growth (Text D, paragraph 2). [4]
Mark Scheme
:
As shown in the diagram, subsidies provided for fuel will help producers to increase their supply ( to ) and reduce consumer prices ( to ). Fuel is an essential input for the fishing and aquaculture industries, so subsidies on fuel reduce their operating costs. By providing economic support to producers, the government aims to increase production in these industries, thereby increasing economic output.
:
For drawing a correctly labelled demand and supply diagram showing:
- a downward/rightward shift of the supply curve ()
- either of the following ()
- an increase in quantity
- a fall in price
AND
Explaining that subsidies on fuels create economic growth by:
- decreasing operating costs ()
- incentivising producers to increase supply ()
2d
Mark as Complete
Using a production possibilities diagram, explain the impact of Maldives’ government spending on infrastructure (Text D, paragraph 5). [4]
Mark Scheme
Maldives is building infrastructure like an international airport and Agronat Corporation to support agriculture. Thus, limited resources of the economy are diverted towards increasing economic infrastructure from to . However, as the economy reallocates its limited resources, it would need to cut down its social spending from to .
:
For drawing a correctly labelled PPC showing:
- a trade-off between economic infrastructure and social spending ()
- increasing expenditure on economic infrastructure decreases social spending ()
AND
Explaining that providing more economic infrastructure reduces funds available for social services (). Therefore, Maldives faces a trade-off: increasing economic infrastructure reduces the provision of social services ().
2e
Mark as Complete
Using an international trade diagram, explain the effect of India imposing tariffs on imports from Maldives (Text D, paragraphs 3 and 4). [4]
Mark Scheme
:
If India imposes a tariff on goods imported from Maldives (tuna fish and scrap iron), then the volume of imports will reduce. In a free market, the world supply curve is perfectly elastic att he world price, . At price without any barrier, the Indian producers supply only as is lower than the domestic equilibrium price, and the quantity demanded is . The shortage ( - ) is imported, including from Maldives. But if India decides to impose a barrier in the form of a tariff, then the new price () will shift upward by a fixed amount. At this new price, Indian producers are willing to supply an increased quantity () but the quantity demanded contracts to units. The shortage (- ) can be imported. However, the tariff causes a reduction in the volume of imports. This reduces the revenue of foreign exporters but will increase the Indian government revenue for the collection of tariff revenue equal to area e.
:
For drawing a correctly labelled international trade diagram showing:
- the domestic quantity supplied and demanded with shortage imported without any trade barrier ()
- the domestic quantity supplied and demanded with reduced imports after a tariff barrier is imposed ()
AND
Explaining that: in a free market and at world price which is below the domestic equilibrium price a country can import larger volume of goods () after a tariff barrier is imposed the world price also increases causing a reduction in the volume of imports ()
2f
Mark as Complete
Using a market failure diagram, explain the effect of climate change on the fishing industry in Maldives (Text F, paragraphs 1 and 2). [4]
Mark Scheme
:
Many industrial and production processes release greenhouse gases leading to climate change. Thus, as illustrated in the diagram, marginal social costs (MSC) exceed marginal private costs (MPC) due to the harmful effects of climate change. The socially optimal output is at where MSC=MSB. From society’s point of view there is overproduction and a corresponding welfare loss is shown by the triangle. Maldives is particularly vulnerable to the effects of climate change, due to an increased risk of flooding, and dwindling stocks of fish thus causing a market failure. Additionally climate change necessitates fishermen to travel further to find fish, resulting in an increased fuel cost and additional expenses for the fishing industry. Maldives heavily depends on fish product exports thus making the country vulnerable to market failures.
:
For drawing a correctly labelled market failure diagram showing:
- that the marginal social cost is greater than the marginal private cost due to negative externalities of an increase in economic activities ()
- that there is overproduction of goods in a free market, creating a welfare/deadweight loss ()
AND
Explaining that:
- an increase in economic activities affects the climate, and in turn impacts availability of natural resources ()
- the above mentioned changes further adds to an increased cost of production to firms and society at large ()
2g
Mark as Complete
Using information from the text/data and your knowledge of economics, discuss the need for more government intervention in Maldives to promote economic development. [15]
Mark Scheme
:
Economic development refers to the process by which the overall health, well-being, and academic level of the general population of a nation improves . The three core and interrelated pillars of sustainable developmentsocial sustainability, economic sustainability and environmental sustainabilityare vital to development . Maldives experienced high economic growth prior to the pandemic, but the loss of tourism income due to the Indian boycott placed a significant challenge on the economy .
To mitigate the economic challenges arising from the decline in tourism , the Maldives government has taken steps to increase fishing and aquaculture as industries, including subsidies for fuel . This would help in overcoming the loss of revenue, promoting a more equitable distribution of income. However, the impact of government intervention has time lags, and any spending and intervention has an opportunity cost as the government cannot allocate this expenditure to other sectors . Government spending, although fluctuating over the past five years, has continued to rise, but so has the debt-to-GDP ratio, sitting at around in 2022. This debt comes with a cost as there is a liability of interest and principal amount, creating a budgetary strain.
Additionally, to increase financial opportunities for poorer residents living on the outer atolls, Maldives’ government is seeking FDI from Singapore. To improve sustainability, the Maldives government is also looking into renewable energy and waste management .This would help in ensuring that resources are available for future generations . By considering the long run impact of its policies, Maldives government aims to achieve sustainable economic growth .
In the diagram, one can see that currently, Maldives is operating at any point on . However, over a long period of time, foreign aid and the building of economic infrastructure will help the Maldives government to achieve growth indicated by a rightward shift ( to ) .
However, Maldives’ geography limits the gains of infrastructure improvements. Improving infrastructure on one island may not have much impact on residents of other islands . The government is also looking at the social aspect of development by ensuring that residents in outer islands receive potable water in case of a shortage of freshwater . This ensures the well-being of people as their basic needs are met.
In conclusion, achieving sustainable development in Maldives requires a multifaceted strategy encompassing economic diversification, environmental conservation, foreign partnerships, and social welfare, especially in the face of rising challenges .
:
For correctly defining the term economic development by indicating that:
- development refers to the process by which the overall health, well-being, and academic level of the general population of a nation improve ()
For correct use of other relevant terms ()
- e.g., social sustainability, economic sustainability and environmental sustainability, opportunity cost
[2 maximum]
A PPC diagram showing:
- An outward shift of the PPC showing economic growth ()
OR
An AD/AS diagram showing:
- A rightward shift of the LRAS curve leading to an increase in real GDP ()
AND
Linking the idea of economic growth to potential outcomes of the economy ()
[2 maximum]
For identifying distinct ways government intervention can contribute to economic development ()
- e.g., governments are well-suited to provide infrastructure, target specific segments of the population/economy, or improve institutions or the business environment
For explaining any two of the following: ()
- Government intervention helps to overcome economic challenges and provide stability
- Governments can encourage sustainable practices to ensure resources are available for future generations
- Ensuring social aspects of development for well being
[3 maximum]
For adding context to the response by discussing the unique challenges faced by Maldives ()
- e.g., Maldives’ geography limits the impacts of some government intervention
For making arguments supporting government intervention ()
- e.g., Maldives government can enact policies promoting sustainable economic development
For making arguments about the limitations of government intervention ()
- e.g., arguing that time lags limit the effectiveness of government intervention
Providing an evaluative judgement that resolves the specific demands of the essay question. ()
- e.g., Economic development in Maldives requires a multi-faceted approach in light of increasing climate challenges
[4 maximum]
For using text/data to:
- demonstrate the need for government intervention to promote development in Maldives ()
- support an argument for a method of government intervention ()
- support an argument for another method of government intervention ()
- For incorporating text/data into synthesis/evaluation ()
[4 maximum]
[=15 maximum]