IB Physics SL - 2024 - Questionbank
1.2 - Uncertainties & Errors
Uncertainties, Random & Systematic Error, Accuracy & Precision
Question Type
All
Paper
Difficulty
View
Question 1
The volume of a cylinder is calculated from the product of its base area and height. The measurement of the height has an uncertainty of 5% and the uncertainty of the diameter is 1%. What is the uncertainty of the volume of the cylinder?
-
A. 1%
-
B. 5%
-
C. 6%
-
D. 7%
Formula Booklet
Mark Scheme
Video
Revisit
Check with RV Newton
Formula Booklet
Mark Scheme
Solutions
Revisit
Ask Newton
Question 2
A rectangle has length and width .
What is the uncertainty of the perimeter of the rectangle?
-
A. 0.08
-
B. 0.2
-
C. 0.3
-
D. 0.6
Formula Booklet
Mark Scheme
Video
Revisit
Check with RV Newton
Formula Booklet
Mark Scheme
Solutions
Revisit
Ask Newton
Question 3
An experiment requires the measurement of the radius and height of a cylindrical battery to determine its volume. The uncertainty in is and the uncertainty in is .
What is the fractional uncertainty in the volume of the battery?
-
A.
-
B.
-
C.
-
D.
Formula Booklet
Mark Scheme
Video
Revisit
Check with RV Newton
Formula Booklet
Mark Scheme
Solutions
Revisit
Ask Newton
Question 4
A student is using the equation to solve for with the following percentage uncertainties in the measurements.
| Quantity | Uncertainty |
|---|---|
| P | |
| V | |
| T |
What is the percentage uncertainty in the calculated value of n?
-
A. 3 %
-
B. 7 %
-
C. 9 %
-
D. 12 %
Formula Booklet
Mark Scheme
Video
Revisit
Check with RV Newton
Formula Booklet
Mark Scheme
Solutions
Revisit
Ask Newton
Question 5
An electronic balance has a button with “tare” written on it. The reading of the balance is reset to zero when the “tare” button is pressed. Which of the following gives a reason why use of the “tare” button improves the measurement?
-
A. Reduce systematic error
-
B. Reduce random error
-
C. Increase precision
-
D. Reduce percentage uncertainty of the measurement
Formula Booklet
Mark Scheme
Video
Revisit
Check with RV Newton
Formula Booklet
Mark Scheme
Solutions
Revisit
Ask Newton
Question 6
The absolute uncertainty in the radius of a sphere is .
What is the fractional uncertainty in the volume of the sphere?
-
A.
-
B.
-
C.
-
D.
Formula Booklet
Mark Scheme
Revisit
Check with RV Newton
Formula Booklet
Mark Scheme
Revisit
Ask Newton
Question 7
A spring of negligible mass and length of is attached to a fixed point. When the spring is extended by an external force , the length of the spring increases to . The graph shows how the length of the spring varies with the tension in spring. The tension in the spring is equal to , where k is a constant and is the extension of the spring.
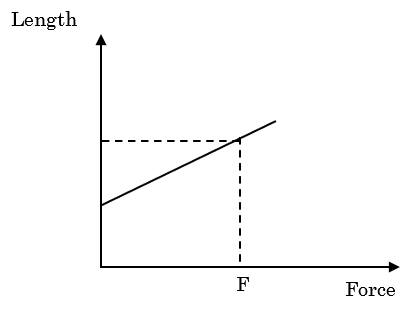
What are the gradient and y-intercept of the graph?
| Gradient | y-intercept | |
|---|---|---|
| A. | ||
| B. | ||
| C. | ||
| D. |
Formula Booklet
Mark Scheme
Video
Revisit
Check with RV Newton
Formula Booklet
Mark Scheme
Solutions
Revisit
Ask Newton
Question 8
A spring with spring constant is extended by a distance .

The uncertainty of is 2% and that of is 3%.
What is the uncertainty of the potential energy stored in the spring?
-
A. 8%
-
B. 11%
-
C. 12%
-
D. 18%
Formula Booklet
Mark Scheme
Video
Revisit
Check with RV Newton
Formula Booklet
Mark Scheme
Solutions
Revisit
Ask Newton
Question 9
[Maximum mark: 8]
A student uses the shown setup to measure the speed of sound.

The sound source has a frequency of 590 Hz. The student changes the distance between the two microphones d and records the time difference t between the received sounds from the microphones.
The graph below shows the data from this experiment.

-
Draw the line of best fit. [1]
-
Determine the fractional uncertainty of d when the time difference t is 2.2 . [2]
-
Showing your working on the graph, calculate the speed of the sound wave.[3]
-
Determine the wavelength of the sound. [2]
Formula Booklet
Mark Scheme
Video (a)
Video (b)
Video (c)
Video (d)
Revisit
Check with RV Newton
Formula Booklet
Mark Scheme
Solutions
Revisit
Ask Newton
Question 10
[Maximum mark: 13]
A student investigates the refraction of light. A light beam emitted from the ray box is incident on a transparent block. The ray trace sheet and the position of the ray box and the transparent block are shown below.

-
The distances a and b are measured. Then the measurement is repeated for different values for angle . The variation of b with a is plotted on the graph below according to obtained data.

Draw the line of best fit for the plotted data on the graph. [1]
-
Theory suggests that
Where is the refractive index of the material and has a constant value.
-
Suggest whether the data is consistent with the theoretical prediction. [2]
-
By using the graph calculate n with its absolute uncertainty for the data point when a is measured to be . [4]
-
The accepted value for the refractive index of the transparent block is 1.71. Comment on your result. [2]
-
Suggest why using the line of best fit to find the value for is better than finding from an individual data point. [1]
Formula Booklet
Mark Scheme
Revisit
Check with RV Newton
Formula Booklet
Mark Scheme
Revisit
Ask Newton
Question 11
[Maximum mark: 13]
In an experiment, a liquid-filled beaker is positioned on an electronic balance. An immersion heater with a power rating of is introduced into the water. Once the water begins to boil, a researcher monitored the change in mass of the liquid over time once the boiling commenced.

The theoretically predicted relationship between time and is
is the initial mass of the liquid when and is the latent heat of vaporisation of water.
-
Give the units of in fundamental SI units. [2]
-
In a particular experiment, the researcher uses a heater of power and measures , , and .
-
Calculate the percentage error in the measured value of . [3]
-
For this experiment, calculate the value of and its absolute uncertainty. [2]
-
The accepted value of is . Explain why the experimental value does not match the accepted value. [2]
-
-
The researcher plots a graph to show how m varies with t.
-
Outline why P must be kept constant during the experiment. [1]
-
Assuming the relationship is correct, sketch the expected mass-time relationship on the axes below. (There is no need to put numbers to the axes). [2]

- Outline how to obtain the value of from the graph you have drawn in c(ii). [1]
-
Formula Booklet
Mark Scheme
Revisit
Check with RV Newton
Formula Booklet
Mark Scheme
Revisit
Ask Newton
Question 12
[Maximum mark: 11]
-
A student investigates standing waves in strings. A string is connected to an oscillator where a function generator can adjust the frequency. The other end of the string passes through a pulley and supports a mass.

The student varied the mass and recorded the values for frequency for which the first harmonic wass visible on the string. The following graph shows the recorded data.

The uncertainty of the mass is negligible.
-
Draw the line of best fit for the plotted data on the graph. [1]
-
By referring to the plotted data, explain why it cannot be stated that frequency is directly proportional to mass. [1]
-
Use the graph to determine the value for with its absolute uncertainty for for [2]
-
-
The theory suggests that
where k is a constant.
The variation of with m is seen on the graph below.

-
Show that the absolute uncertainty of is for . [3]
-
The absolute uncertainty of is for . Construct error bars for when and [1]
-
State and explain whether the theory is supported by data or not. [2]
-
-
Determine the unit of k, in fundamental SI units. [1]
Formula Booklet
Mark Scheme
Revisit
Check with RV Newton
Formula Booklet
Mark Scheme
Revisit
Ask Newton
Question 13
A box moves a distance of ( due to a horizontal force of (.
What is the percentage uncertainty in the work done on the box?
-
A.
-
B.
-
C.
-
D.
Formula Booklet
Mark Scheme
Revisit
Check with RV Newton
Formula Booklet
Mark Scheme
Revisit
Ask Newton
Question 14
The area of one of the faces of a cube is . What is the percentage uncertainty in the volume of the cube?
-
A. 2%
-
B. 4%
-
C. 6%
-
D. 8%
Formula Booklet
Mark Scheme
Revisit
Check with RV Newton
Formula Booklet
Mark Scheme
Revisit
Ask Newton
Question 15
[Maximum mark: 11]
-
A student investigates the variation of gas pressure with volume at a constant temperature. Air is trapped inside a gas syringe with a constant cross sectional area of . The plunger of the gas syringe is tied to a mass holder. The student measures the volume of the trapped gas for different hanging masses with the external constant air pressure, , remaining constant.

-
After each increase in mass, the student waits for some time to measure the volume of the gas. Outline why this is necessary. [1]
The recorded data is plotted on a graph:

-
Draw the line of best fit for the plotted data. [1]
-
Determine the gradient of the graph. [2]
-
-
Theory suggests that
- ;
where m is the total mass of the plunger and hanging masses, g is the acceleration of free fall and k is a constant.
-
Determine the unit of k in SI base units. [2]
-
Calculate the percentage uncertainty of the volume V when the mass m is 700 g. [2]
-
In a particular experiment, the researcher measures
- ,
and
.
- ,
Calculate the absolute uncertainty of . [3]
Formula Booklet
Mark Scheme
Revisit
Check with RV Newton
Formula Booklet
Mark Scheme
Revisit
Ask Newton
Question 16
[Maximum mark: 9]
-
In an experiment, a beaker containing liquid of mass is heated with a heater of power P. Then the variation of temperature T of the liquid with time t is recorded.

The data from the experiment is shown on the graph below.

-
On the graph, draw the line of best fit for the data. [1]
-
Explain why it can not be concluded that the relationship between temperature and time is directly proportional. [1]
-
-
Theory suggests that
where is the temperature when s.
-
Using the data given, calculate the percentage uncertainty of at time . [2]
-
Use the graph to determine constant k. [2]
-
Theory also suggests that another expression for k is given by
- , where c is another constant.
Determine the units of constant c, expressing your answer in fundamental SI units. [2]
Formula Booklet
Mark Scheme
Revisit
Check with RV Newton
Formula Booklet
Mark Scheme
Revisit
Ask Newton
Question 17
A student investigates gas behaviour. A volume of gas is trapped in a capillary tube by a thin layer of oil. The tube, a thermometer and a ruler are immersed in water.

The student slowly added boiling water and recorded the values of the temperature T of the water and the height h of the gas trapped inside the capillary tube. The recorded data is plotted on a graph as shown.

-
Draw the best fit line for the graph plotted data. [1]
-
The theory suggests that
where m and C are constant. Temperature T is in C.
-
Suggest whether the data are consistent with the theory. [2]
-
By using the graph drawn in (a), determine the constants m and C. [4]
-
State the units of the gradient in fundamental SI units. [1]
-
Following the experiment, the student tested their thermometer in an ice bath and in boiling water. The temperatures were 2C and 102C respectively.
-
Explain how this finding will affect how the student interprets their results. [2]
-
The student also goes on to find the intercept on the temperature axis. Will this error cause their intercept value to be higher or lower than expected? [1]
-
Formula Booklet
Mark Scheme
Revisit
Check with RV Newton
Formula Booklet
Mark Scheme
Revisit
Ask Newton
Question 18
[Maximum mark: 9]
-
The circuit shown is used to measure the variation of the resistance R of a wire with the length L of the wire. The wire is connected across points and .

A voltmeter and an ammeter are connected to the circuit in order to investigate the relationship.
-
Draw the ammeter and voltmeter on the given circuit with their correct connections. [2]
-
State the purpose of connecting a resistor in series with the wire as shown in the diagram. [1]
-
-
The diameter d of the wire is kept constant at . Determine the percentage uncertainty of the cross sectional area A of the wire. [2]
-
The graph shows the variation of resistance of the wire R with the wire's length L.

-
Draw the line of best fit. [1]
-
Use the graph to estimate the resistivity of the wire. [3]
-
Formula Booklet
Mark Scheme
Revisit
Check with RV Newton
Formula Booklet
Mark Scheme
Revisit
Ask Newton
Question 19
[Maximum mark: 7]
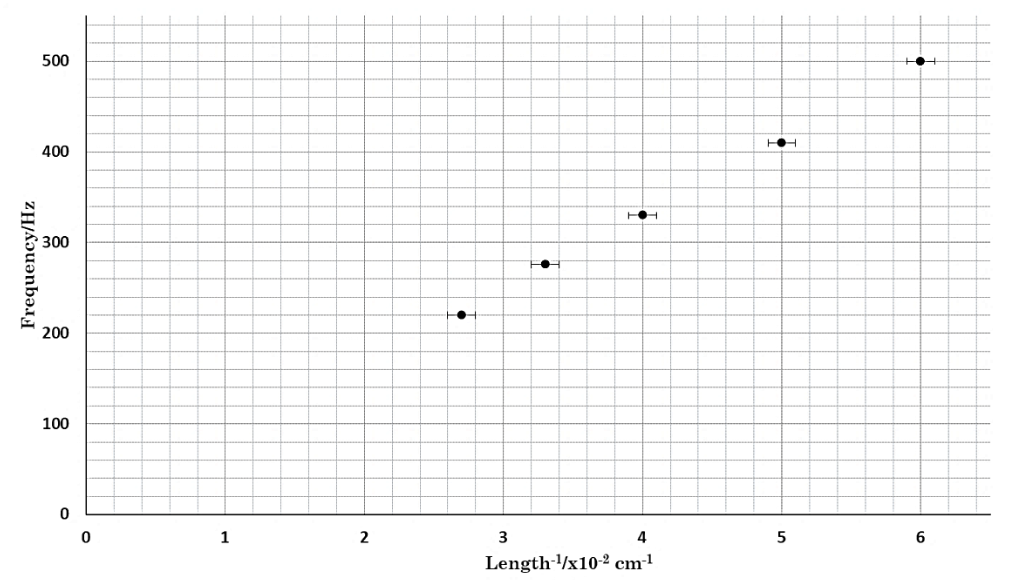
In an experiment to determine the speed of sound in air, some students used a number of tuning forks of known frequencies and a tube with a moveable piston arranged as shown below.
For each tuning fork they used the setup shown in the diagram.

The students would sound the tuning fork, then move the piston slowly downwards until a loud sound is first heard. The length L was then measured. This was repeated for different tuning forks.
The graph shows the variation of with frequency.
-
Draw the line of best fit. [1]
-
Calculate the fractional uncertainty of when the length is . [2]
-
-
Determine the gradient, expressing your answer with the correct SI units. [2]
-
Use the gradient calculated in (i) to determine the speed of sound. [2]
-
Formula Booklet
Mark Scheme
Revisit
Check with RV Newton
Formula Booklet
Mark Scheme
Revisit
Ask Newton
Question 20
A rectangular prism is obtained by combining two identical cubes as shown in the figure.
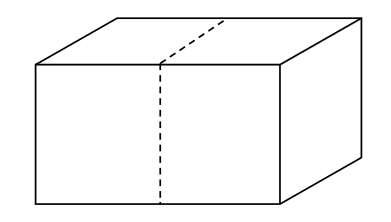
The length of one side of a cube is .
What is the ratio
?
-
A.
-
B. 1
-
C. 2
-
D. 5
Formula Booklet
Mark Scheme
Video
Revisit
Check with RV Newton
Formula Booklet
Mark Scheme
Solutions
Revisit
Ask Newton
Question 21
[Maximum mark: 12]
In an experiment, the free-fall of a ball bearing is used to measure the acceleration due to gravity. The ball bearing is suspended with an electromagnet. Then it is released from a height of above a table.

The time t needed for the ball bearing to reach the ground after release is measured. The experiment is repeated for different values of . The theoretically predicted relationship between time t and h is
-
State why there is a need to collect data for a range of values of to verify this relationship. [1]
-
The experimental data for and h are plotted on the graph below.

-
Draw the line of best fit for the plotted data on the graph. [1]
-
Suggest whether the data is consistent with the theoretical prediction. [2]
-
By using the line of best fit, determine a value for g and state the units. [4]
-
-
The theoretical relationship is for an object falling in a vacuum.
-
Compare the experimental result to the accepted value of g and suggest a reason for the discrepancy. [2]
-
State and explain whether the source of error in (c)(i) is a systematic or random error. [2]
-
Formula Booklet
Mark Scheme
Revisit
Check with RV Newton
Formula Booklet
Mark Scheme
Revisit
Ask Newton
Question 22
In finding the area of a circular metal plate, a student measures the radius of the plate and calculates the area to be , where is the absolute uncertainty on the area. Which of the following would give the fractional uncertainty on ?
-
A.
-
B.
-
C.
-
D.
Formula Booklet
Mark Scheme
Video
Revisit
Check with RV Newton
Formula Booklet
Mark Scheme
Solutions
Revisit
Ask Newton
Question 23
The mass and circumference of a standard volleyball are and respectively. What is the percentage uncertainty in the density of the ball calculated from these values?
-
A.
-
B.
-
C.
-
D.
Formula Booklet
Mark Scheme
Video
Revisit
Check with RV Newton
Formula Booklet
Mark Scheme
Solutions
Revisit
Ask Newton
Question 24
An object starting from rest travels a distance after a time . If , and the time is measured as . Which of the following gives the correct values of the fractional and absolute uncertainties of acceleration?
Assume constant acceleration.
| Fractional | Absolute | |
|---|---|---|
| A. | 0.25 | 2.5 |
| B. | 0.30 | 3.0 |
| C. | 0.45 | 4.5 |
| D. | 1.4 | 14 |
Formula Booklet
Mark Scheme
Video
Revisit
Check with RV Newton
Formula Booklet
Mark Scheme
Solutions
Revisit
Ask Newton
Thank you Revision Village Members
#1 IB Math Resource
Revision Village is ranked the #1 IB Math Resources by IB Students & Teachers.
34% Grade Increase
Revision Village students scored 34% greater than the IB Global Average in their exams (2021).
80% of IB Students
More and more IB students are using Revision Village to prepare for their IB Math Exams.
More IB Physics SL - 2024 Resources
Frequently Asked Questions
What is the IB Physics SL Questionbank?
The IB Physics SL Questionbank is a comprehensive set of IB Physics exam style questions, categorised into syllabus topic and concept, and sorted by difficulty of question. The bank of exam style questions are accompanied by high quality step-by-step markschemes and video tutorials, taught by experienced IB Physics teachers. The IB Physics SL Question bank is the perfect exam revision resource for IB students looking to practice IB Physics exam style questions in a particular topic or concept in their IB Physics Standard Level course.
Where should I start in the Physics SL Questionbank?
The IB Physics SL Questionbank is designed to help IB students practice Physics SL exam style questions in a specific topic or concept. Therefore, a good place to start is by identifying a concept that you would like to practice and improve in and go to that area of the Physics SL Question bank. For example, if you want to practice Physics SL exam style questions covering Momentum & Impulse, you can go to Physics SL Topic 2 (Mechanics) and go to the Momentum & Impulse area of the question bank. On this page there is a carefully designed set of IB Physics SL exam style questions, progressing in order of difficulty from easiest to hardest. If you’re just getting started with your revision, you could start at the top of the page with the easiest questions, or if you already have some confidence, you could start at the medium difficulty questions and progress down.
How should I use the Physics SL Questionbank?
The Physics SL Questionbank is perfect for revising a particular topic or concept, in-depth. For example, if you wanted to improve your knowledge of Forces, there are over 20 IB Physics SL exam style questions focused specifically on this concept. Alternatively, Revision Village also has an extensive library of Physics SL Practice Exams, where students can simulate the length and difficulty of an IB exam with the Mock Exam sets, as well as Physics SL Key Concepts, where students can learn and revise the underlying theory, if missed or misunderstood in class.
What if I finish the Physics SL Questionbank?
With an extensive and growing library of full length IB Physics SL exam style questions in the Physics SL Question bank, finishing all of the questions would be a fantastic effort, and you will be in a great position for your final exams. If you were able to complete all the questions in the Physics SL Question bank, then a popular option would be to go to the Physics SL Practice Exams section on Revision Village and test yourself with the Mock Exam Papers, to simulate the length and difficulty of an actual IB Physics SL exam.