Question
Biology
How does a peppered-moth graph support natural selection?
Answer
Biology
Expert Answer
A peppered-moth graph can support natural selection by showing a change in the relative frequency of inherited colour forms across generations. This means that the proportion of each form changes, in a way consistent with differences in survival and reproduction. To explain why, you also need evidence about what happened to the moths and their environment.
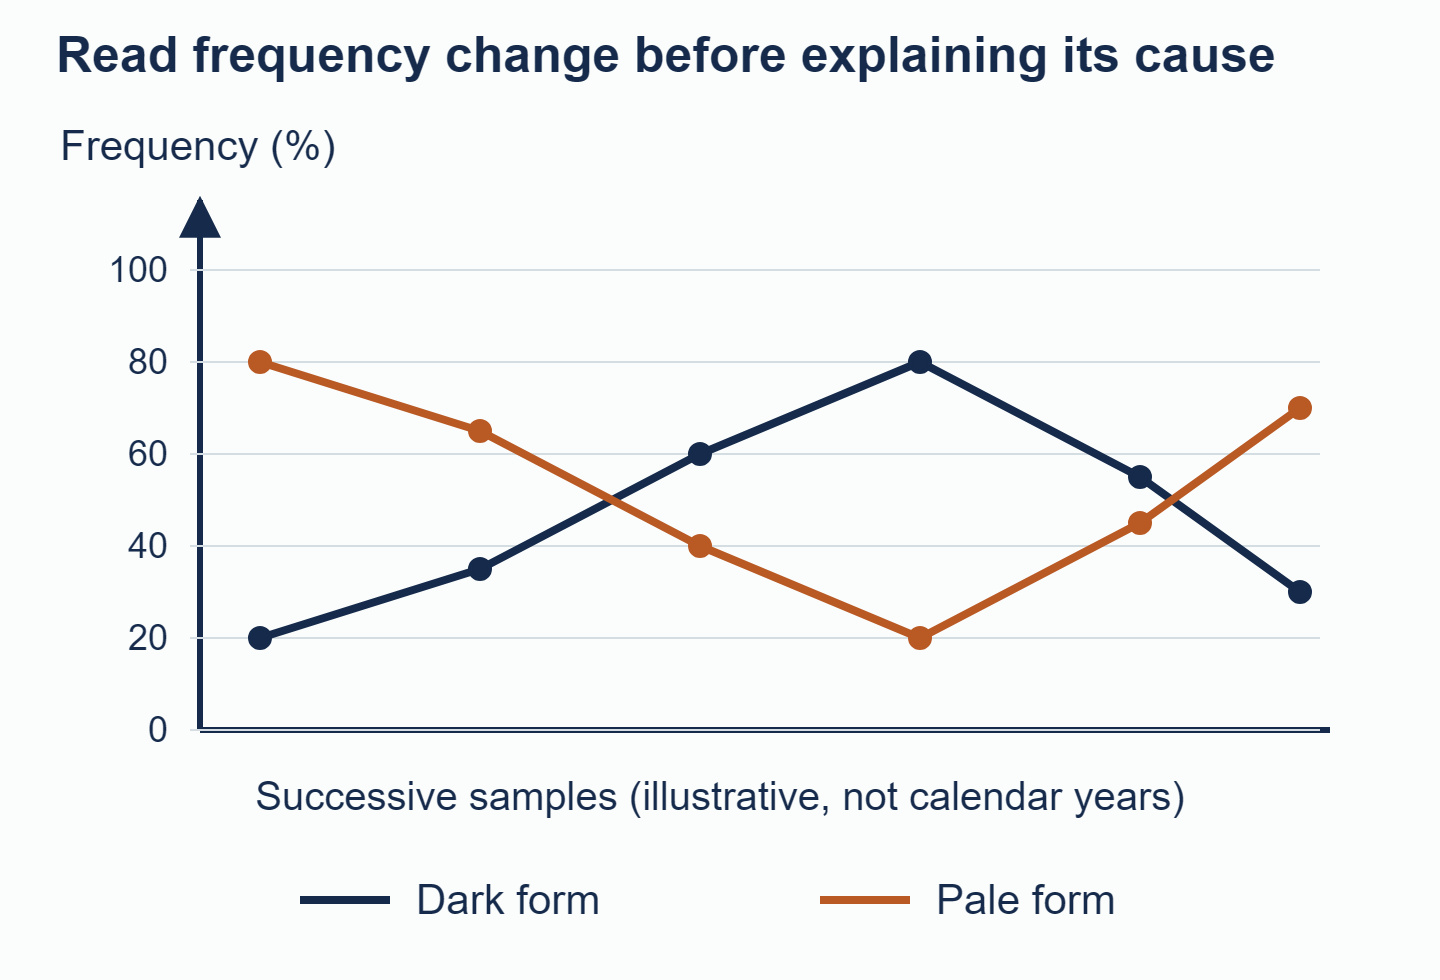
An invented series shows opposite changes in two colour forms; these are not historical measurements.
The graph here is invented to practise interpretation; it is not a historical dataset. Dark moth frequency rises from 20% to 80%, then falls to 30%. If there are only two forms, pale frequency changes in the opposite direction. A rise from 20% to 80% is 60 percentage points, or a relative increase of
Neither statement tells you the number of moths unless population size is also known. A percentage can increase even while the total population falls.
Start with variation that already exists and can be inherited. On a darker resting background, dark moths may be harder for predators to see. If this camouflage helps them survive to reproduce, they can pass on their alleles more often. When the environment changes, the advantage can shift to the other colour form.
In the historical case, soot and changes in lichens altered the backgrounds on which moths rested. Later environmental improvement was associated with a reversal in dark-moth frequency. The key is that some inherited forms survived and reproduced more successfully than others, not that pale moths became genetically dark when soot covered them.
A graph over time shows a pattern, but does not prove every step of its cause. Migration, sampling methods and other differences in reproductive success could also affect frequencies. Stronger evidence comes from comparing predation or survival in the relevant conditions and checking inheritance. In Cook and colleagues' analysis of Majerus's field experiment, birds preyed more on dark moths in the study's post-industrial environment, supporting the camouflage explanation.
When answering a graph question, state the period and the variable, quantify a representative change, then connect variation, selection pressure and inheritance. Do not claim that pollution produced the useful colour mutation in response to need. Selection changes the contribution of inherited variants to later generations; it does not anticipate what a population will require.
Try reading the peppered-moth graph in the Biology Unity and Diversity questionbank. Check what the vertical axis measures before calculating a change, then connect the trend to inherited variation, camouflage and reproductive success.
Answered by Revision Village IB Expert
Explore More IB Biology Resources
Over 80% of IB students globally are experiencing the power of Revision Village