Question
Economics
How does a production possibilities curve show increasing opportunity cost?
Answer
Economics
Expert Answer
A production possibilities curve (PPC) shows the maximum combinations of goods an economy can produce with its resources and technology. It shows increasing opportunity cost when equal increases in one good require giving up more and more of the other. The curve becomes steeper as production moves towards the good on the horizontal axis.
Consider an economy that can produce bicycles and tents each week. Assume its resources and technology are fixed and each combination below uses those resources efficiently.
| Combination | Bicycles per week | Tents per week | Tents given up for the next 20 bicycles |
|---|---|---|---|
| A | 0 | 100 | 10 |
| B | 20 | 90 | 20 |
| C | 40 | 70 | 30 |
| D | 60 | 40 | 40 |
| E | 80 | 0 | No further move shown |
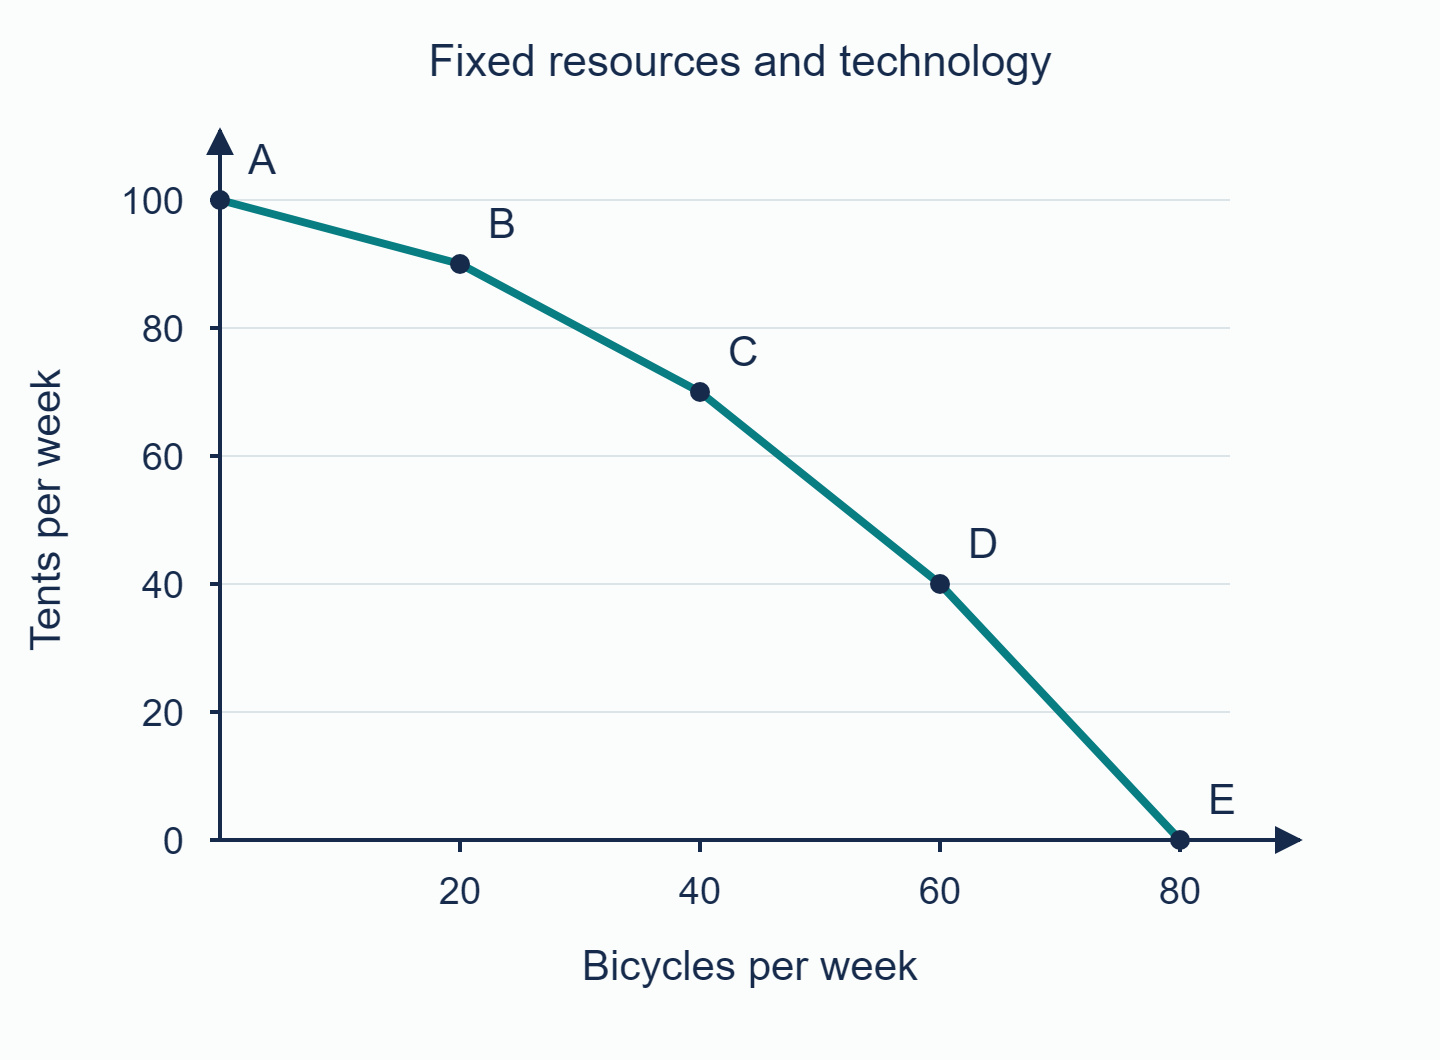
The economy gives up more tents for each extra 20 bicycles as it moves from A towards E.
From A to B, 20 extra bicycles cost 10 tents. The opportunity cost per bicycle is
From B to C, the same additional 20 bicycles cost 20 tents, or 1 tent each. The next two movements cost 1.5 and 2 tents per bicycle. By comparing equal increases in bicycles, you can see that each increase costs more tents.
For this graph, the size of the slope, ignoring its negative sign, measures opportunity cost:
The triangle-shaped delta symbol means a change in output. The minus sign turns the fall in tent output into a positive amount given up. On a smooth PPC, the slope at a point gives marginal opportunity cost: the trade-off for a small extra increase in output. Our table instead gives the average cost between each pair of points, which the graph joins with straight lines.
Why does the cost rise? Resources are not equally suited to both products. The first workers moved to bicycles might already be skilled in metalwork and contribute relatively little to tent production. Making still more bicycles may require moving specialist fabric workers and equipment away from tent-making, where they are much more productive. Each additional batch of bicycles then costs more tent output.
This explanation relies on movement along an efficient frontier. If an economy starts inside the PPC because workers or machines are idle, it may increase both outputs by using those resources better. It need not sacrifice tents immediately.
Do not confuse a movement along the PPC with an outward shift caused by more resources or improved technology. Also keep the units clear: 20 tents is the cost of the whole B-to-C movement, whereas 1 tent is the cost per additional bicycle. The diagram shows an increasing trade-off under fixed conditions, not a rule that every expansion of bicycle production must always reduce tents.
Try reading the guns-and-butter production possibilities curve in the Economics Foundations Questionbank. Explain what the economy must give up as it moves along the curve, and how the changing slope shows the opportunity cost.
Answered by Revision Village IB Expert
Explore More IB Economics Resources
Over 80% of IB students globally are experiencing the power of Revision Village